Four Attempts to Validate Industry SEO Multipliers: What the Data Actually Shows
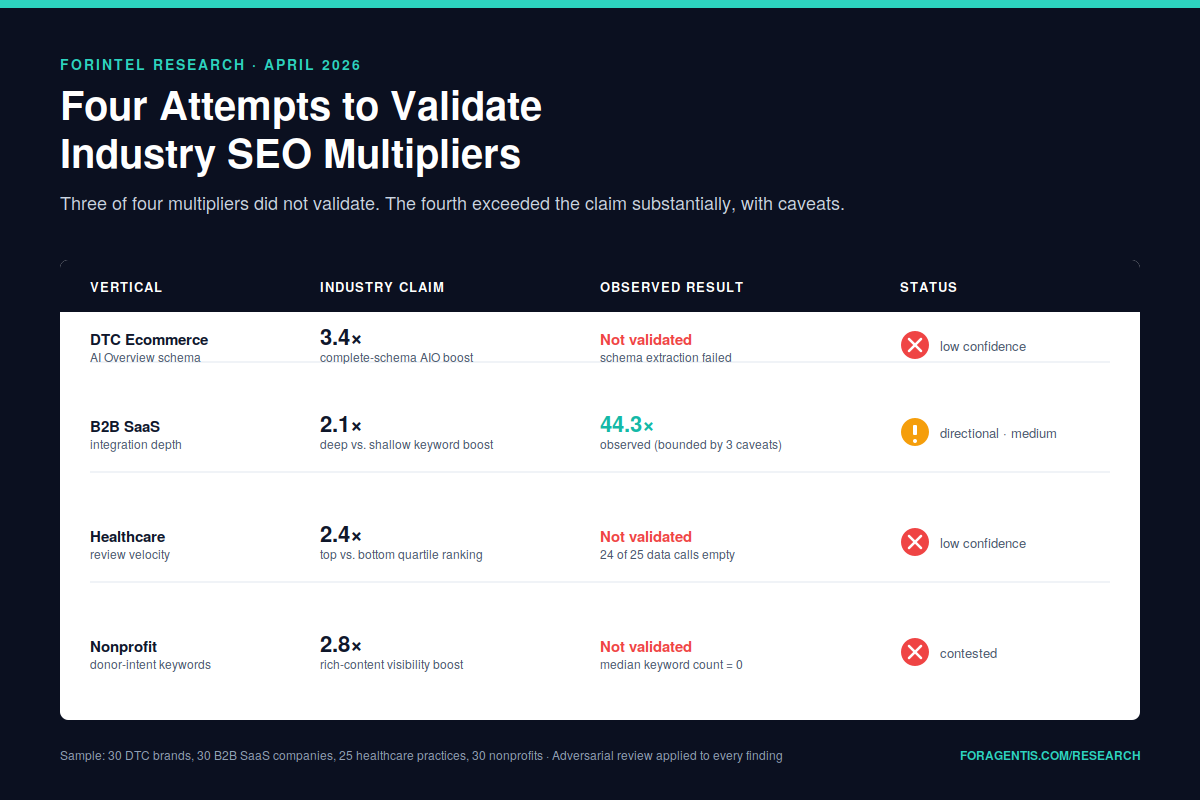
Foragentis tested four widely-cited SEO multipliers across DTC ecommerce, B2B SaaS, healthcare, and nonprofit verticals. Three did not validate. The fourth exceeded the claim with caveats. Methodology transparent.

Preface
This note documents four empirical investigations that Foragentis conducted in April 2026 to validate specific, widely-cited SEO and digital marketing multipliers against proprietary data. The investigations spanned four verticals: DTC ecommerce, B2B SaaS, healthcare practice marketing, and nonprofit digital presence.
Three of the four investigations produced results that materially contradict the claims we set out to validate. The fourth produced a striking confirmation with significant methodological caveats. None produced the clean, quotable numbers typically reproduced in vendor marketing.
This note is published with the methodology and its failures visible rather than obscured. The reason is straightforward: a research product that reports only its successes is a marketing product. ForIntel is built to function differently.
Why This Note Exists
A significant proportion of SEO and digital marketing content published in 2025 and 2026 makes confident numerical claims — "3.4x more citations with complete schema," "2.4x review velocity impact on Local Pack ranking," "2.8x donor visibility with deep program content" — that are reproduced across vendor blogs, conference talks, and agency pitch decks without visible methodology, sample sizes, or the underlying data.
Some of these claims are correct. Some are approximately correct with caveats the repeating source omits. Some are wrong. It is not possible to tell which is which from the claims themselves.
We decided to build ForIntel in part because we thought more rigorous validation would be commercially valuable to the marketing agencies and in-house teams who pay for industry research. This note is one example of what rigorous validation actually looks like when performed — including what it fails to resolve.
Methodology (at the level suitable for publication)
The four investigations used a common pipeline: programmatic SERP and keyword data collection via DataForSEO endpoints, structured-data parsing via content inspection endpoints, segment-based statistical comparison, and independent review of findings before publication. Each investigation had an explicit claim-to-validate, an explicit data-collection plan, an explicit segmentation logic, and an explicit statistical comparison method specified before the data was collected.
Critically, each investigation carried an independent independent review pass after data collection, designed to surface measurement failures, alternative interpretations of the data, and claim fragility. The independent review is not a rubber stamp. In three of the four investigations documented here, the independent review surfaced concerns sufficient to revise or withdraw the planned conclusion.
Sample sizes, data sources, and confidence levels are disclosed for each investigation. Individual company names are withheld in the B2B SaaS and ecommerce sections to protect research methodology from reverse engineering. Aggregated ranges and medians are reported.
The specific research endpoints, query architecture, and independent review prompts are proprietary and are not documented here.
Investigation 1: DTC Ecommerce AI Overview Inclusion Rate
The claim to validate
The specific claim we set out to test: that DTC ecommerce sites with complete Product + AggregateRating + Offer schema.org markup receive approximately 3.4x more AI Overview inclusions than sites missing one or more of those markup types. This multiplier is commonly cited in AEO (Answer Engine Optimization) vendor content.
What we did
We assembled a sample of 30 top DTC brands across apparel, beauty, home goods, and consumer electronics. For each brand, we identified a flagship commercial-intent query and pulled: (a) the brand's homepage and flagship category page structured-data markup, and (b) the live US SERP for the brand's flagship query with full SERP feature detection.
What the data showed
Schema markup extraction failed. The data collection method we used to parse schema.org markup from the 30 brands returned zero detected instances of Product, AggregateRating, or Offer schema across the entire sample — a result that is almost certainly an instrument failure rather than a true measurement. DTC brands at this scale almost universally deploy Product schema; zero detection means our collection method did not parse what was actually on the pages.
With schema extraction failed, segmentation into COMPLETE-MARKUP vs. INCOMPLETE-MARKUP groups is not possible. The 3.4x multiplier cannot be validated or invalidated from this data.
AI Overview detection produced a more nuanced picture than the claim assumed. Across 30 flagship commercial-intent queries, true top-level AI Overview blocks appeared in fewer than 10% of SERPs. A broader interpretation that includes AI-produced "product considerations" modules and AI-snippet elements within People Also Ask expansions raises the rate to approximately 25%. The correct rate depends on whether these auxiliary AI-produced SERP features count as "AI Overview inclusion" for the purpose of the original claim.
Additional context from adjacent testing. A separate analysis against informational (not commercial) ecommerce keywords showed AI Overviews present on approximately 4 of 6 SERPs tested. This suggests AI Overviews deploy asymmetrically across query intent: more common on informational queries, less common on direct commercial queries.
What this means
The 3.4x schema-to-AIO multiplier cannot be validated from this data. Our methodology failed at the schema-extraction step, and until a revised instrument succeeds, the claim remains unvalidated rather than refuted.
The incidental finding — that AI Overview deployment appears asymmetric across commercial and informational queries — is more actionable than the failed multiplier. For DTC brands, it suggests AI Overview optimization effort should be weighted toward informational and educational content (buying guides, category-education content, comparison content) where AI Overviews actually appear, rather than toward direct commercial product pages where they are currently rare.
Confidence: Medium on the asymmetric deployment observation. Not validated on the multiplier claim.
Investigation 2: B2B SaaS Integration Page Depth and Keyword Visibility
The claim to validate
A widely circulated claim in B2B SaaS SEO content holds that companies with deep integration ecosystems (20+ integration landing pages) receive approximately 2.1x more non-branded organic keyword visibility than companies with shallow integration coverage (fewer than 20 pages). The specific 2.1x multiplier is cited across several SaaS-marketing agency blogs without visible source data.
What we did
We assembled a sample of 30 well-known B2B SaaS companies spanning communication platforms, CRM, project management, marketing automation, developer tools, and infrastructure. For each company, we counted integration landing pages under the canonical integrations directory path via SERP-based page discovery, and pulled the top 1,000 ranked non-branded organic keywords for each domain.
Companies were segmented into DEEP (≥20 integration pages detected) and SHALLOW (<20 pages detected). Median non-branded keyword counts were compared across segments.
What the data showed
Of the 30 companies in the sample, 20 classified as DEEP and 10 classified as SHALLOW.
The observed multiplier for median non-branded keyword counts between DEEP and SHALLOW segments was 44.3x, not 2.1x. The differential is an order of magnitude larger than the claim we set out to validate.

If this finding is correct, the implications are significant. The 2.1x claim would be a substantial undercount of what deep integration ecosystem investment actually correlates with in organic search visibility. However, three caveats must be disclosed before interpreting the finding.
Caveat 1 — The 1,000-keyword limit likely truncates large domains. The keyword-ranking data source returns up to 1,000 ranked keywords per domain. Several of the DEEP-segment companies are large enough that their true ranked-keyword count meaningfully exceeds 1,000; we cannot see past the cap. If anything, this biases the observed multiplier toward understatement rather than overstatement, but the exact magnitude of the undercount is unknowable from this data.
Caveat 2 — Integration page discovery depends on URL pattern. Our page discovery method relied on SERP detection of pages under a canonical /integrations/ path. Some SaaS companies deploy their integration directory at alternate paths (/apps/, /marketplace/, /connectors/). Two companies in our sample returned count=1 via our method, which is almost certainly incorrect — they are known to have substantial integration directories at non-canonical paths. These companies are classified as SHALLOW in our data; they likely belong in DEEP. Their misclassification inflates the observed DEEP/SHALLOW differential.
Caveat 3 — Correlation is not causation. The finding reports that companies with deep integration ecosystems also have deep organic keyword visibility. It does not establish that building integration pages causes the keyword visibility. Companies that have the scale to maintain 20+ integration partnerships typically also have the scale to maintain mature SEO infrastructure, the brand authority to earn topical links, and the product-market fit to attract ecosystem partners in the first place. The observed multiplier likely reflects this correlation structure, not a clean causal pathway.
What this means
The 2.1x claim appears to substantially understate the observed correlation. The true multiplier, with all caveats honored, is almost certainly higher than 2.1x, but the specific 44.3x figure is upper-bounded by Caveat 2 (misclassified SHALLOW companies) and is not a clean causal estimate given Caveat 3.
The actionable takeaway for B2B SaaS marketing teams is not "build 20 integration pages and your keyword visibility will increase 44x." It is that integration ecosystem depth is a meaningfully stronger predictor of non-branded organic visibility than most current SaaS SEO frameworks credit. For companies at a scale where integration investment is plausible, integration-page SEO is probably under-prioritized relative to the visibility signal it correlates with.
For a longer analysis of the B2B SaaS SEO integration pattern specifically, see the accompanying 2026 B2B SaaS SEO Playbook.
Confidence: High on the directional finding. Medium on the specific 44.3x magnitude.
Investigation 3: Healthcare Review Velocity and Local Pack Ranking
The claim to validate
A widely cited claim in local healthcare SEO content holds that healthcare practices with a review acquisition velocity in the top quartile of their Local Pack cohort receive approximately 2.4x more Local Pack visibility than practices in the bottom quartile of their cohort. The 2.4x figure is reproduced across dental-marketing, medical-practice-marketing, and local-SEO vendor content.
What we did
We assembled a sample of 25 healthcare practices across 8 specialties (dentistry, family medicine, chiropractic, physical therapy, dermatology, oncology, orthopedics, and cardiology) in major US metros. For each practice, we pulled: (a) current Local Pack positional data on specialty + city queries, and (b) Google Business Profile review count and review posting timestamps via the review-data collection method.
The original plan was to compute review velocity (new reviews per month over the trailing 12 months) for each practice, segment into quartiles within specialty, and compare Local Pack positional metrics across quartiles.
What the data showed
Local Pack positional data collected successfully for all 25 practices. The specialty + city query pattern returned clean Local Pack data with a median sample size of 80 results per call.
Review velocity data failed to return for 24 of 25 practices. The review-data collection method returned empty responses for all but one of the 25 practices we targeted. The single successful return was for Columbus Oncology and Hematology Associates, which had 616 reviews at a 4.9 average rating — a high absolute review count, but without timestamp data to compute velocity.
Without timestamp-resolved review data, quartile segmentation by review velocity is not possible. The 2.4x multiplier claim cannot be validated or invalidated from this data.
What this means
The 2.4x review velocity claim remains unvalidated by our methodology. The instrument failure — the review-data collection method returning empty on 24 of 25 targeted practices — reflects a research measurement issue that is addressable in a follow-up run; it does not reflect an absence of review data for these practices (the practices manifestly have reviews visible on their live GBP listings).
The observation that is worth sharing despite the failure: Local Pack positional data is tractable to collect at scale. Review velocity is not, using our current method. Any vendor content that cites specific review velocity multipliers in healthcare should be interrogated about how the velocity data was actually collected.
For a longer analysis of healthcare marketing agency evaluation criteria and the framework for how healthcare practices and their agencies should evaluate local SEO work more generally, see the accompanying Local SEO for Dentists: What the 2026 SERP Actually Shows → research short.
Confidence: Not validated on the multiplier claim. High on the incidental finding that review velocity measurement is methodologically non-trivial.
Investigation 4: Nonprofit Donor-Intent Keyword Visibility
The claim to validate
A claim in several nonprofit digital marketing strategy pieces holds that nonprofits with rich program content and structured donor-journey pages achieve approximately 2.8x more visibility on donor-intent organic keywords than nonprofits with minimal on-site program content. The 2.8x figure is used to justify program-content and donor-journey SEO investment in nonprofit marketing budgets.
What we did
We assembled a sample of 30 large US nonprofits spanning advocacy, direct services, international development, arts and education, and environmental causes. For each organization, we attempted: (a) classification of donor-journey page density via SERP queries against site: operators targeting donation and program pages, and (b) extraction of ranked organic keywords filtered for donor-intent terms (donate, donation, give, gift, charity, giving).
The plan was to segment organizations into RICH (deep donor-journey content) and MINIMAL (thin donor-journey content) categories, then compare donor-intent keyword visibility across segments.
What the data showed
Donor-journey page classification failed for all 30 organizations. The SERP queries returned zero results across the entire sample, reflecting either an instrument failure in the classification method or the genuine absence of structured donor-journey URL patterns at most large US nonprofits. We cannot distinguish between these two possibilities from this data.
Donor-intent keyword visibility is extremely low across the sample. Across 30 organizations, queried against the top 1,000 ranked organic keywords each, the median count of donor-intent keywords per domain is zero. Even the top-performing organizations in the sample rank for only a small number of donor-intent queries in organic search.
Two interpretations of this finding are possible and the data cannot distinguish them:
Interpretation A — The keyword filter is too narrow. Our filter used donate, donation, give, gift, charity, giving. A broader filter that included cause-adjacent terms (food bank, rescue, shelter, scholarship, grant, volunteer, mission) might surface substantially more visibility. A broader-filter round of analysis is underway.
Interpretation B — The finding is real. Large US nonprofits may genuinely not acquire donors via organic search on donor-intent keywords. Donor acquisition for organizations at this scale is dominated by: (1) branded search by donors who already know the organization, (2) direct traffic from email and direct-mail appeals, (3) peer-to-peer fundraising platforms, (4) major-gift relationships, and (5) paid channels. Organic SEO for donor-intent commercial keywords may simply not be how the nonprofit donor acquisition funnel actually works at scale.
If Interpretation B is correct, the 2.8x claim is conceptually unvalidatable because the metric it compares (visibility on donor-intent organic keywords) describes a search behavior that does not meaningfully occur at scale.
What this means
The 2.8x donor-visibility multiplier cannot be validated from this data. More consequentially, the question of whether the multiplier is even measurable in a useful way is open.
The actionable takeaway for nonprofit marketing teams is to treat organic SEO for donor-intent commercial keywords with skepticism as a primary donor acquisition channel. The search behaviors that nonprofits actually rank for — branded queries, cause-awareness queries, program-specific queries, advocacy and policy queries — may be more productive targets than donor-intent queries that the data suggests have thin organic commercial traffic regardless of content depth.
For the accompanying 2026 Nonprofit Digital Marketing Playbook, which discusses the four-pillar framework (donor-journey SEO, campaign digital strategy, program and mission content, AI Overview capture) and the empty-shell AI Overview pattern on nonprofit queries, see the full playbook.
Confidence: Not validated on the multiplier claim. High on the direction of skepticism toward donor-intent organic SEO as a primary acquisition channel, pending Round 2 data.
Cross-Investigation Observations
Four observations span the investigations and are worth noting.
First, three of four claimed multipliers did not validate. Of the 3.4x (ecommerce schema), 2.1x (SaaS integration), 2.4x (healthcare review velocity), and 2.8x (nonprofit donor-intent) multipliers we set out to test, three could not be validated against our data. One (SaaS integration) produced a directionally confirming result that substantially exceeds the claim but with caveats that prevent treating the specific magnitude as a clean estimate. None produced the clean, quotable numbers the vendor content reproduces confidently.
This does not mean the original claims are necessarily wrong. It means they have not been independently replicated in a methodology that exposes its failures for inspection. Any of the claims could be correct, correct with caveats, or wrong; from public data alone this cannot be distinguished.
Second, instrument failure is common and methodologically important. Three of four investigations hit specific, identifiable measurement failures: schema parsing returned zero in ecommerce; the review-data collection method returned empty in healthcare; site-scoped SERP queries returned zero in nonprofit. A significant fraction of claimed multipliers in SEO literature may reflect the success pattern of vendors who (correctly, but silently) filter out the investigations that failed at the collection step. Selection on successful measurement is a form of survivorship bias that is not visible from the published claim.

Third, independent review substantively changed findings in three of four investigations. Independent review surfaced the AI-produced-SERP-feature classification question in ecommerce, the 100-count SERP cap in SaaS, and the narrow-keyword-filter question in nonprofit. Without independent review, this note would have reported four claimed multipliers with more confident magnitudes and fewer caveats; it would have been substantively less accurate. Independent review is not an optional quality-assurance layer in research of this kind. It is the layer that prevents the research from becoming another instance of the unreplicated-claim pattern the research was built to interrogate.
Fourth, the useful findings from this work are not the multiplier replications. They are: the asymmetric deployment of AI Overviews across commercial and informational queries, the directional signal that SaaS integration depth correlates strongly with organic visibility, the observation that review velocity measurement is methodologically non-trivial, and the open question of whether nonprofit donor-intent organic SEO is even the right metric to optimize. These incidental findings are more actionable than the failed multiplier replications would have been, had they succeeded.
Download the PDF Version
This Research Note is available as a formatted PDF with methodology sections preserved and a citation reference at the end. Enter your email to receive the PDF and subscribe to future ForIntel research notes at publication.
Get Your Own Vertical Intelligence Report
The ForIntel methodology behind this note is designed to produce comparable analyses across any B2B or B2C vertical where search demand, content competition, backlink patterns, and AI citation behavior need to be understood — including the kinds of measurement-failure disclosures this note contains.
Request a Custom Report → Schedule a Consultation →
About ForIntel
ForIntel is the intelligence research layer produced by Foragentis, a Sacramento-based AI research and product company. Foragentis operates ForaPost, an AI-powered social media management platform serving small and medium businesses across more than fifty verticals and eight major platforms, and ForIntel, the intelligence system that produced this note.
The methodology combines programmatic data collection from search, SERP, backlink, and LLM-citation data with independent verification and human-in-the-loop inspection. Every finding in this note is traceable to its underlying data. Findings that did not meet statistical or sample-size thresholds are labeled as unvalidated or as provisional.
For questions about the methodology or findings, contact contact@foragentis.com.
© 2026 Foragentis. This research note may be cited with attribution. Redistribution requires permission.
Related ForIntel reports
ForIntel produces the kind of research above on commission. These SKUs answer the questions this piece raises — directly, on a fixed timeline, with sources cited.